The Potential of Big Data and Cycling
26.05.2015

Did you know that after buses, cycling is the most effective use of road space? It’s not really surprising if you think about it, but still a cool statistic. Last week I attended the 4th National German Bicycling Congress. This year it was conveniently held around the corner from the IASS in Potsdam – so, ironically, I didn’t even need to bike there, I could just walk. While there were many interesting talks and presentations, I really enjoyed the opening plenary talk given by Lilli Matson from Transport for London. Given the sometimes ghastly conditions for biking in London, it isn’t necessarily the first city that pops into your head when thinking about cycling, but there is a growing bicycling movement there, and it is clear that Transport for London is doing a lot to try and foster that – including making things far safer for bicyclists. For a start, they are using their leverage as one of the largest construction work contractors in London to make additional training for ‘lorry’ (truck) drivers on bicycles a requirement! The idea is that drivers who have cycled on the roads as part of their training become more aware of more vulnerable road users. I think that’s quite innovative and probably also very effective as one way to improve safety. They have also been working with police to crack down on bicycle theft – something the police were not so interested in initially, until they found that there was a link between bicycle theft and bigger, organised crime. Not sure who figured that out, but getting your bicycle stolen is the worst, so if that little titbit of information means police will be more active in tracking and working to reduce bike theft, awesome!
I could go on all day about the interesting things I learned from Lilli Matson’s talk and what Transport for London is doing and has in store, but there was one other talk I would like to mention. This talk was in the Digital Media session entitled BikePrint – cyclists´ data as background for bicycle traffic planning given by Dirk Bussche (NHTV/DAT.Mobility, the Netherlands). He showed how much is possible when ‘big data’ is combined with urban planning. Bussche and his colleagues have some amazing data and are doing some really cool things with it. During his talk, Bussche showed GPS tracks of bicycle trips around Eindhoven and Breda. This includes information on routes, speeds and times of day. In order to foster a transition from cars to bikes, riding bikes has to be the better way – better as in more appealing, easier, faster, more convenient, etc. There will always be a small fraction of the population that will want to go by bike regardless of conditions and ease, but for many, the lower you can make the barrier or the higher the incentives, the better. This is the challenge for urban transport planning, since a transition from cars to public transport, and especially from cars to bikes, can help address issues like air pollution and climate change by reducing emissions.
Bussche pointed out that “bikes are not mini cars.” Seems like stating the obvious, right? But what does that really mean? He meant this in the sense of planning and analysis. For example, ideal driving times for cars are calculated based on the speed at which car drivers can get from point A to B in the middle of the night (basically, when there is no traffic on the road to slow drivers down). For bikes, they tried to use the same calculation but quickly realised that bike speeds are slower at night than during the day, so it doesn’t work. Slower probably because when people bike at night, they are not in as much of a hurry to get to their destinations, but are in many cases going out or biking home after a few drinks. So a different baseline is needed.

Another planning difference is speed. Bussche pointed out that it isn’t their job to dictate the speed at which bicyclists should ride, but rather to make whatever speed they want to bike at possible (within reason). He showed a few plots to demonstrate what he meant by that. In two cases, the bicyclists rode fairly consistently at their desired speed – at 10 km/h for one and 20 km/h for another – without a lot of slowing down or speeding up (as depicted in the left and middle plots of Figure 1). In the case of the third plot (on the right side of Figure 1), it was clear that the cyclist kept having to slow down significantly and then speed up again, sometimes managing to reach their desired speed of 30 km/h but never being able to maintain it for long. So the challenge from the urban planning perspective is to figure out why that is, and if possible, make that desired speed feasible.

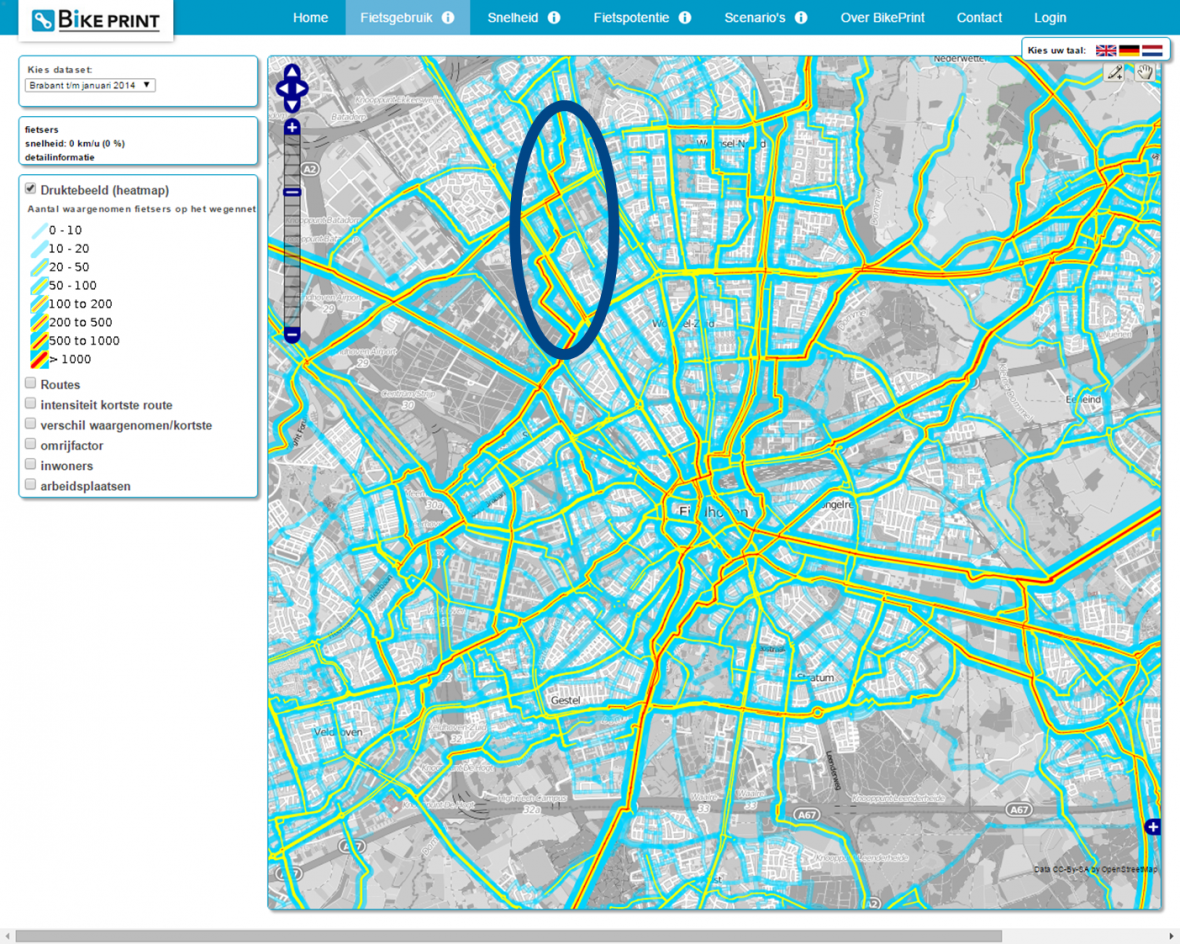
One example where big data proved to be a major advantage for urban planning was bicycling routes and the associated investment of resources, for example, in maintenance or infrastructure. The city has ‘main’ cycle routes, which means that infrastructure has been put in place for cyclists to facilitate a direct pathway through the city. In many cases you can see that, as expected, the cycle traffic in the area tends to follow these routes, as they are the most direct. But in a few areas the data might show that the majority of the cycle traffic ends up zigzagging through side streets even though a main thoroughfare supposedly exists (the circled area in Figure 2). Since the main routes are where resources are focused, if bicyclists avoid this route in favour of other streets, it is clear that something needs to be changed. In this case, the disincentives could be a poor road surface (cobblestones) or a traffic light that has a particularly long wait time.
The final example I want to highlight showed a situation where bicyclists often cycle where there isn’t technically a road or cycle path – in this case, cycling from a dead end to the nearby road by going over a few curbs or through a small bit of grassy area (Figure 3). Here the question is: should infrastructure be added to facilitate this connection for bikes and pedestrians, or is this actually a significant safety hazard and should the connection be closed? Such data allows for a targeted investigation of these situations to inform investments in infrastructure that can foster cycling as a preferred transport option and facilitate optimal use of resources and the best possible cycling network.

In all cases, urban planning for bicycling infrastructure cannot be done in isolation. The bigger picture, including the range of transport options and city design, has to be considered as well, but these talks were just two of the many examples that showed the potential for bicycles as a mode of transport in cities. Learning about initiatives like these gets me thinking about the role cycling plays in our own work at the IASS – from using bicycles to conduct air pollution measurements to quantifying their potential to reduce air pollution in cities in a shift from cars to bikes, and all the possibilities yet unexplored.
Header photo: istock/focusstock
