A Science Perspective on the Volkswagen Emissions Scandal
09.10.2015

When I initially heard about the VW scandal, it was secondhand and I hadn’t read any of the news yet, I didn’t have any of the facts. But I remember thinking (and saying), I don’t know what the big deal is about, everyone knows those chassis dynamometer tests they use for estimating emissions don’t get anywhere close to the real-world emission values. Then I read about it and saw what all the fuss was about – 35 times higher than the US limit value?! And cheating software to pass the test?! After talking with some colleagues, we decided to look into this a bit further and do some modeling runs to be able to say something about the implications for air quality.
The reality of diesel emissions in Europe
In modeling air quality we typically use emission inventories based on officially reported data. This means that if governments assumed that the emissions of these diesel vehicles were as good as their chassis dynamometer tests showed, emissions of nitrogen oxides (NOx) would be way underestimated. (In reality this is, however, not the case and I’ll come back to this.) So I dug into the data, looking up the original report from West Virginia University (WVU) that had been commissioned by the International Council on Clean Transportation (ICCT) and got the emission factors (the amount of NOx emitted per kilometre driven) that first alerted them that something was not right. Then I looked up some reports that document emission factors (not the emission standards) for the different vehicle types that governments might use as part of the official emission reporting protocol. In addition I pulled together the different emission standards in Europe and the US. First of all, the emission standards that are in place in the EU are far more lax than those in the US. It’s something I was aware of, but had never really looked into how different they are. Even with Euro 6, the standards for NOx for diesel passenger cars will still be twice as high as the Tier 2 standards implemented in the US from 2004 to 2009. Then I started comparing the emission factors. At first when I had the data all in front of me I was sure I must have done something wrong – maybe inadvertently converted grams/miles to grams/km wrong or something. But nope, the current estimates of emission factors for European diesel passenger cars are pretty bad. In some cases, for example highway driving, the highest emission factors measured in the WVU study were actually lower than the highway driving emission factor measured for the Handbook Emission Factors for Road Transport. Surely that couldn’t be correct.
How good could our air quality be? Planning a study

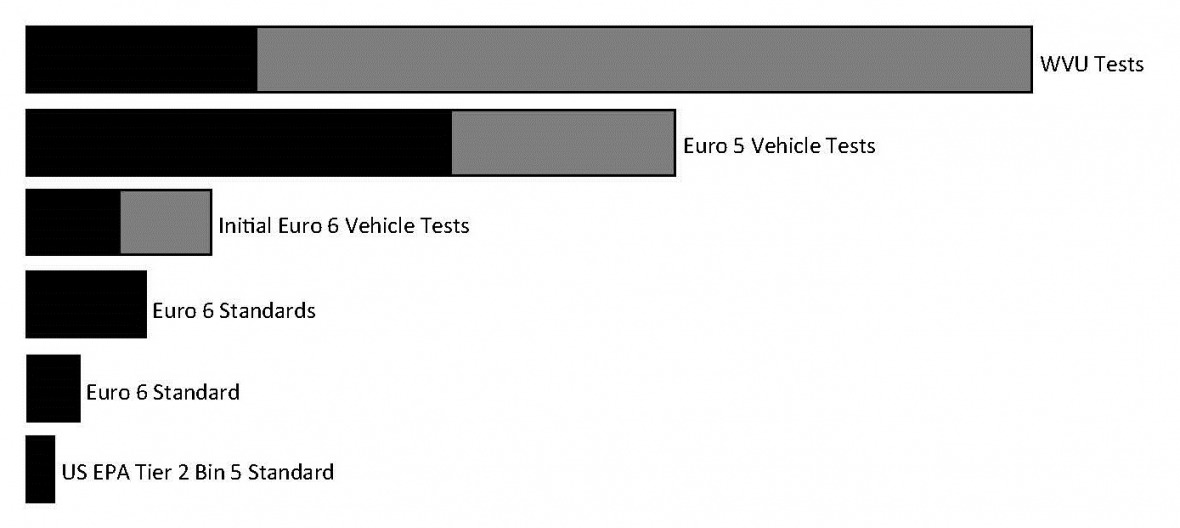
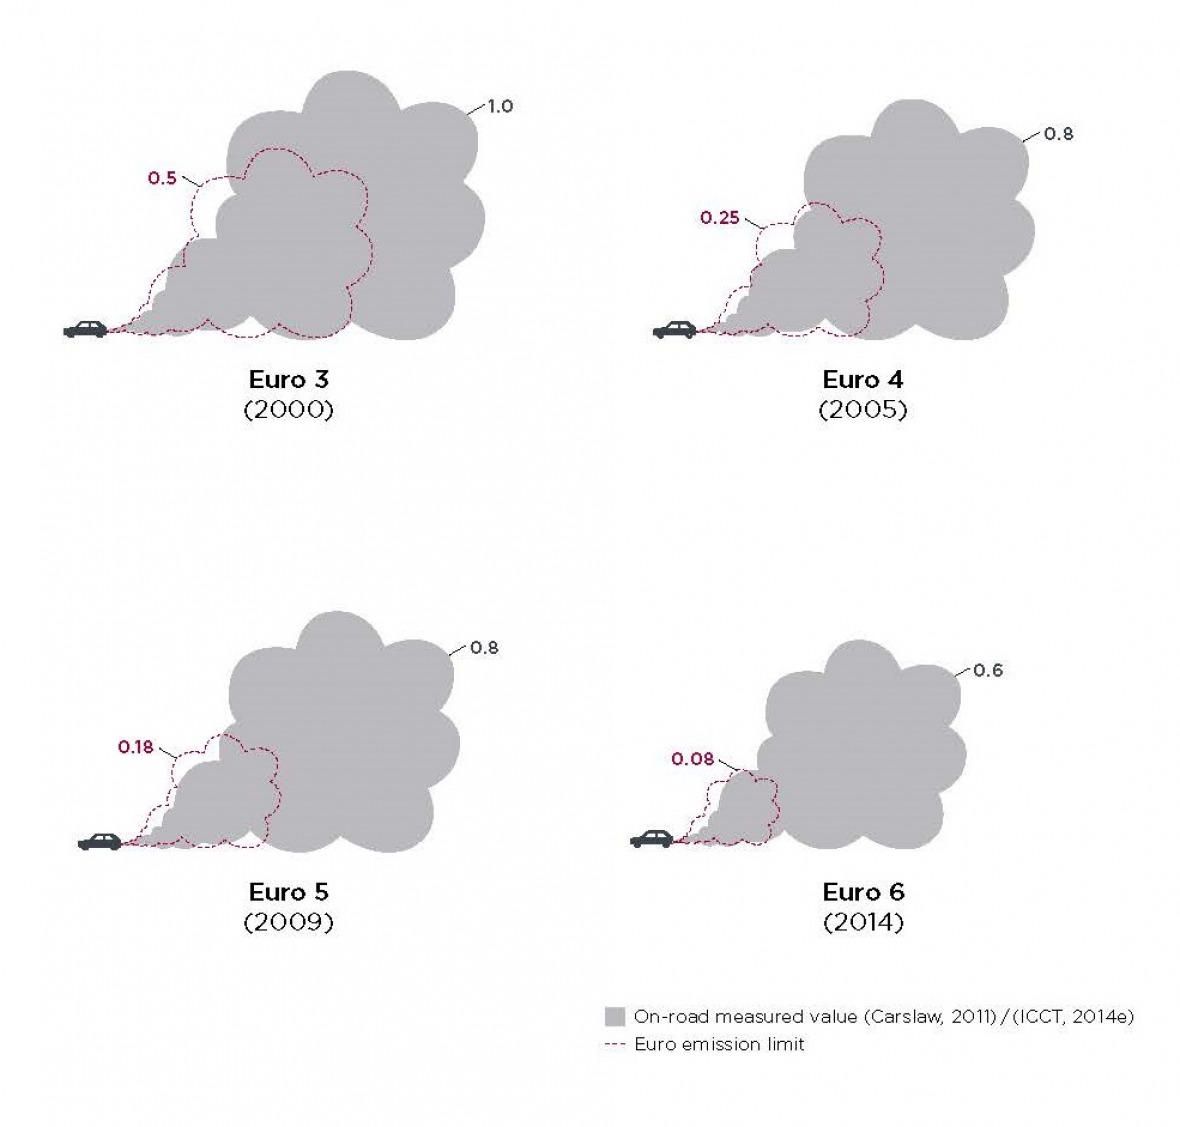
Now, compared to the expected emission factors for cars built for the Euro 6 standard, the WVU data was higher by a factor of 2 to 10, but that’s nowhere near the 35 times that was found when compared to the US standard. That’s a pretty big fail for EU emissions. I put this comparison in graphical form (Figure 1), which makes it pretty clear. But this isn’t exactly a revelation. In conversations I’ve had with colleagues in various government positions, it’s clear that they’re aware of, and lament the fact that the current fleet and Euro 5 standards haven’t delivered what was promised in terms of NOx emission reductions. I think this graphic from the ICCT European Vehicle Market Statistics Pocketbook sums it up pretty well. In the graphic (Figure 2) the cloud outlined with the red dotted line is what the emissions should be according to the Euro standards; the gray cloud is what the actual emissions have been shown to be. And the comparison of the reported emissions factors I found mirrors this.
So we’ll follow through and do a study to see what the increase in emissions (albeit much more minimal than we previously thought) means for air quality. But after a discussion with colleagues, we came to the conclusion that the much more interesting question is probably how good could our air quality in Europe be if the cars actually met the existing and planned standards?
When we have our study results, feel free to check back – I’ll follow up and report on what we’ve found.

Header photo: istock/luckyraccoon
